Monitoring Role
Gravity exposes metrics which can be scraped by Prometheus
less than a minute
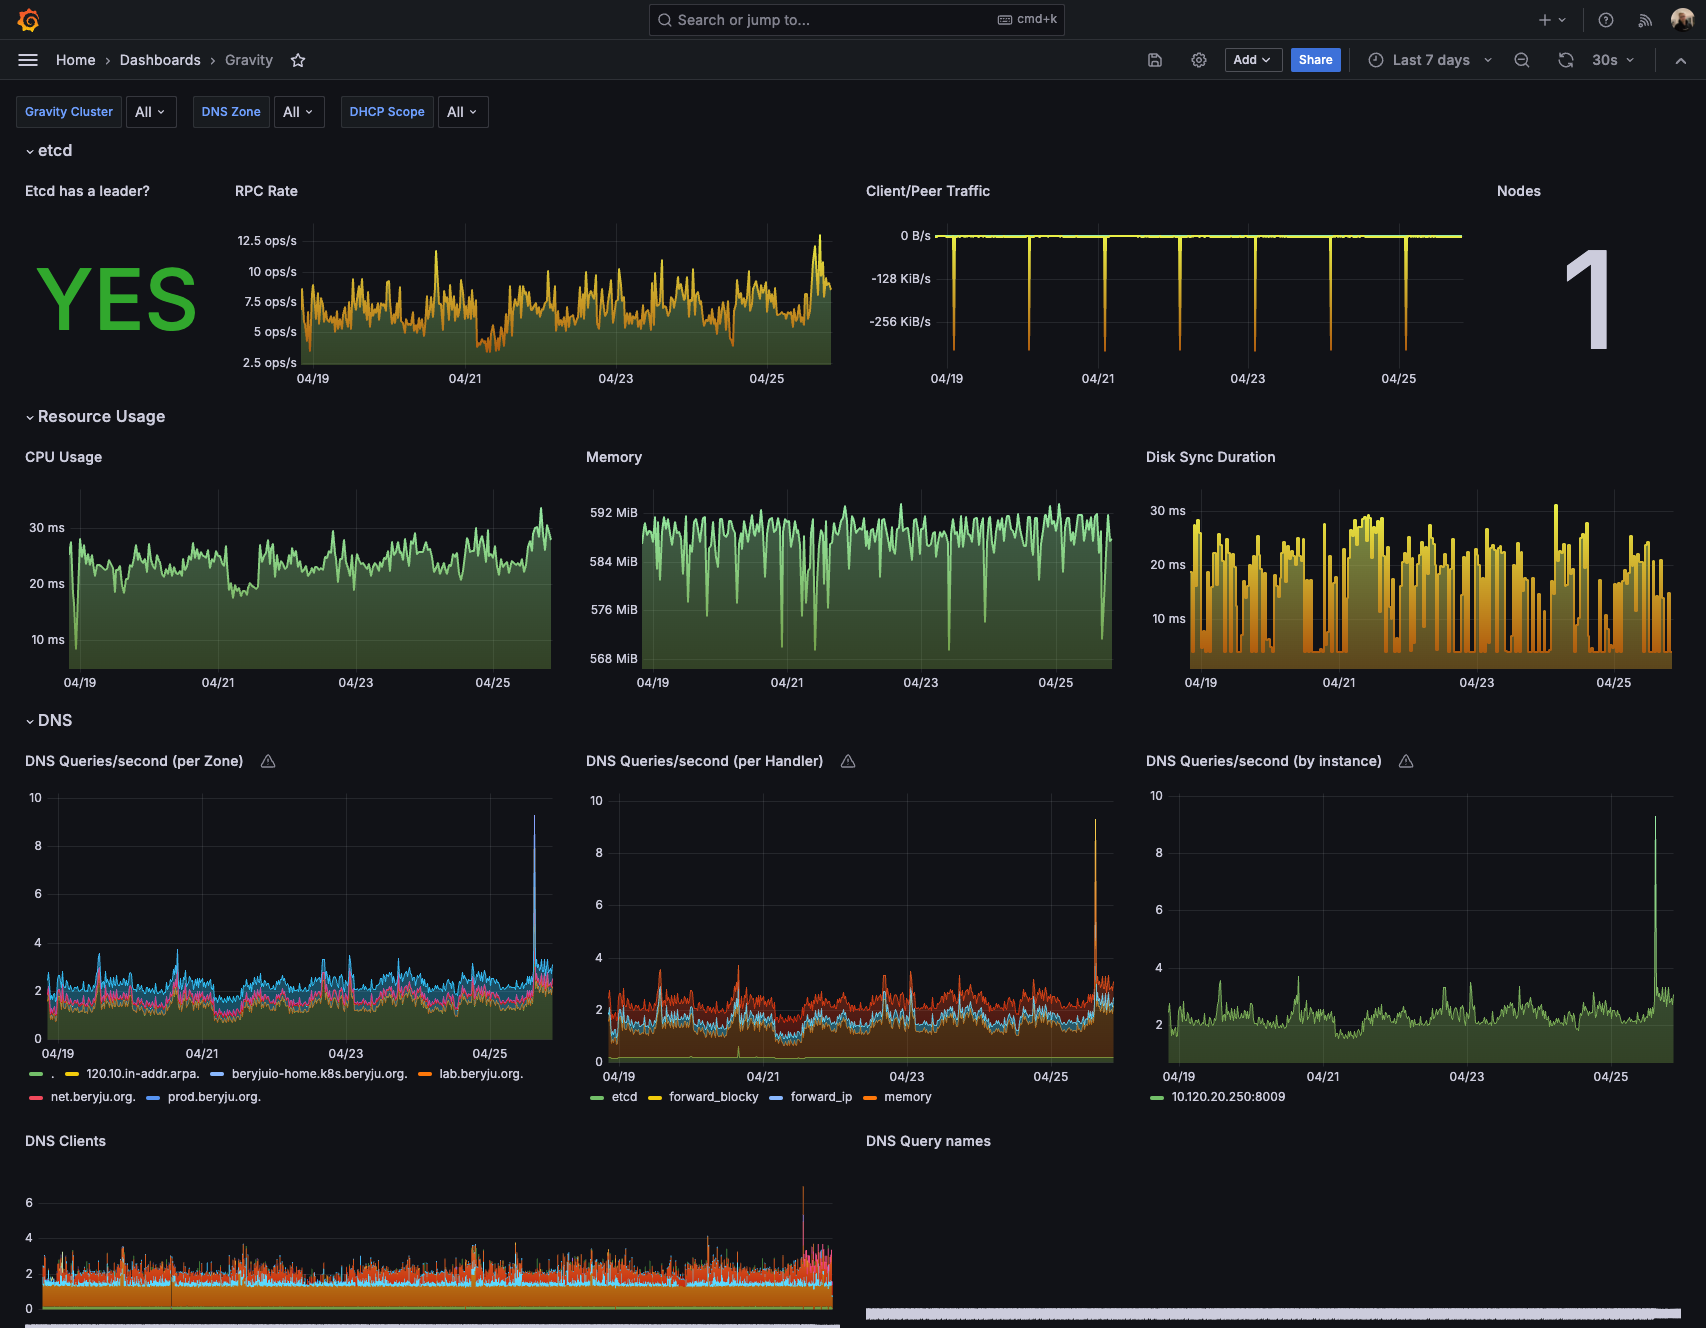
Gravity exposes Prometheus metrics on a separate port (default 8009) under /metrics. A Grafana dashboard can be found here.

less than a minute
Gravity exposes Prometheus metrics on a separate port (default 8009) under /metrics. A Grafana dashboard can be found here.
